AllSight 8.0.0.2 Delivers Toys and Options
Hello once again! Winter is just starting to break here in New England, people are starting to poke up their heads like a groundhog. We’ve been hunkered down busy making improvements, and it’s a long list this release! New toys, new options, new settings, plenty for everyone to enjoy. So let’s get started with…
Login Durations Report
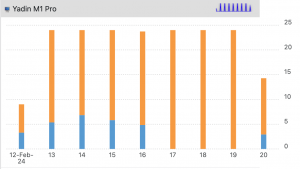
New report module, Login Durations (COMP)! Fairly simple, rather specific, but very useful in some settings. Best used with a Target so you don’t have hundreds of little charts in the output. For each day in the Date Range, it shows a bar of how many hours the computer was In Use. There is an Option to include Idle events so the active and idle time are both visually shown. Mouse over a bar to see a popup of the time total you are hovering over. Handy for visually showing on an individual basis the usage of hardware (or virtual systems) in a lab space.
Division Colors
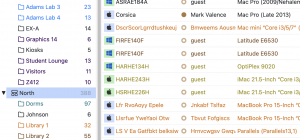
Long has there been the ability to color code Divisions in KeyConfigure. This feature has now made it to the web! Right click a division and Edit to change the color. All Computers in that division will be shown in that color. And if you already did this in KeyConfigure, the rainbow will now be seen in the Web UI.
Purchase and Policy Alarms
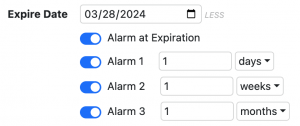
This is half feature that is now available in the Web, half brand new feature. When setting the expire date on a Purchase record in KeyConfigure, you could click a little bell to pop up editing the alarm schedule. Our Purchasing enthusiasts will be happy to hear this is now in the Web UI, and as usual even better than in the desktop tool.
In addition, there are new global settings for the default schedule of these reminders. Seems some folks didn’t like having to edit every single record to their defaults 😉 Oh and for those who already have a bunch of records, Quick Edit can also modify these reminder settings. For those using Policy expirations, same deal. Head to Settings -> Alarms in the web UI to set these defaults.
Computer Property Widget Options
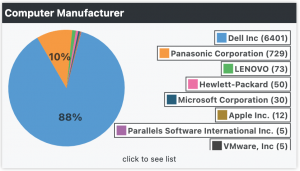
This was always one of my favorite widgets because it’s so many widgets in one. Pick any of the various data fields to display a graphic. OS distribution, BIOS version, Graphics Model, RAM size, available disk space… And of course like all widgets it can be scoped or respond to the active Dashboard Scope. Mouse over a pie slice to see details, and click to get a list of the relevant computers. Cool stuff. And now it’s cooler.
Now you can choose to display a legend on the widget. You can choose how many legend items to show (the rest are dynamic merged to “other”). By default the legend shows a count while the pie slice shows a percentage, so more data available. You can however now choose an option to show counts on the chart as well. And, the legend items are ALSO clickable just like the pie slices.
Computer Count Widget Options
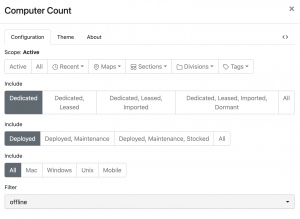
Another big widget update! Before the Computer Count widget was really a simple one trick pony. How many computers you got? That’s it. Now it has all the options many other widgets have, to set the Scope and Include items. Additionally, it allows you to pick a Computer Filter. Now this pony is full of tricks! Add a widget to show total computer count. Then another to show only those that lack TPM (by Filter). Then another to show only the machines in active loaner inventory (another Filter). And sky’s the limit from there.
Saved Column Views
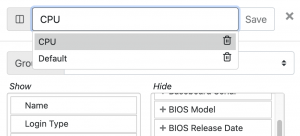
One of the big enhancements to 8.0 was the ability to choose any data columns to display in the Web UI. This allowed for several other things like searching by any data shown and saving out the records displayed with the chosen data. But there are a LOT of columns and you may have multiple use cases. One moment you need to see all the CPU information, the next all the Lifecycle/Asset information, and in neither case do you want the other columns in the way. We present to you, Saved Views. Now in the column choice dialogue you can give a name to your view selections and Save it. Then flipping to another set of columns is as easy as picking it from the list and clicking OK.
Other Stuff
- Right clicking various items in the Web UI offers a Report drop down which will auto Target that item in the Builder (e.g. Divisions, Filters).
- On report result pages, you can select some items and use Create with Selection in the corner pull down to Target those items in a new Report Builder.
- Shift Click on the + on the Maps page (upper right) to toggle showing any Division that does not have a Floorplan.
- In Device History the computer names are now clickable links to the computer detail record.
- Owner, Managed By, and Loan To fields are now clickable links to Users if linked to a user record.
- Some Detail pages now have a Download button in the upper corner. e.g. the Software or History of a Computer can be downloaded to CSV.
- Hardware Replacement now has a Deferred status and Return action as available options.
- When importing Computers, there is a new option to ONLY parse based on the Computer ID types set on the server (e.g. don’t use fallbacks to try to merge on Name if that’s not a set ID).
- New option in Histogram Logins (DIV) report to use Seat Allocations. Use with Aggregation * to see the actual KeyServer “license use” over time.
- Floorplan Properties have enhanced settings for Heatmaps to set the initial visibility state.
Whew… did I mention we’ve been busy? And of course as always there is the usual list of bug fixes in our Component History. Hope you all enjoy these new items, see you next update!
Author: Yadin Flammer
Site Search
Documentation Search
Categories
Social
Subscribe
| Thank you for Signing Up |


