Usage Reporting
Whether replacing hardware or renewing software, our built in report options give stakeholders easy access to the data you need.
Dynamic Insight
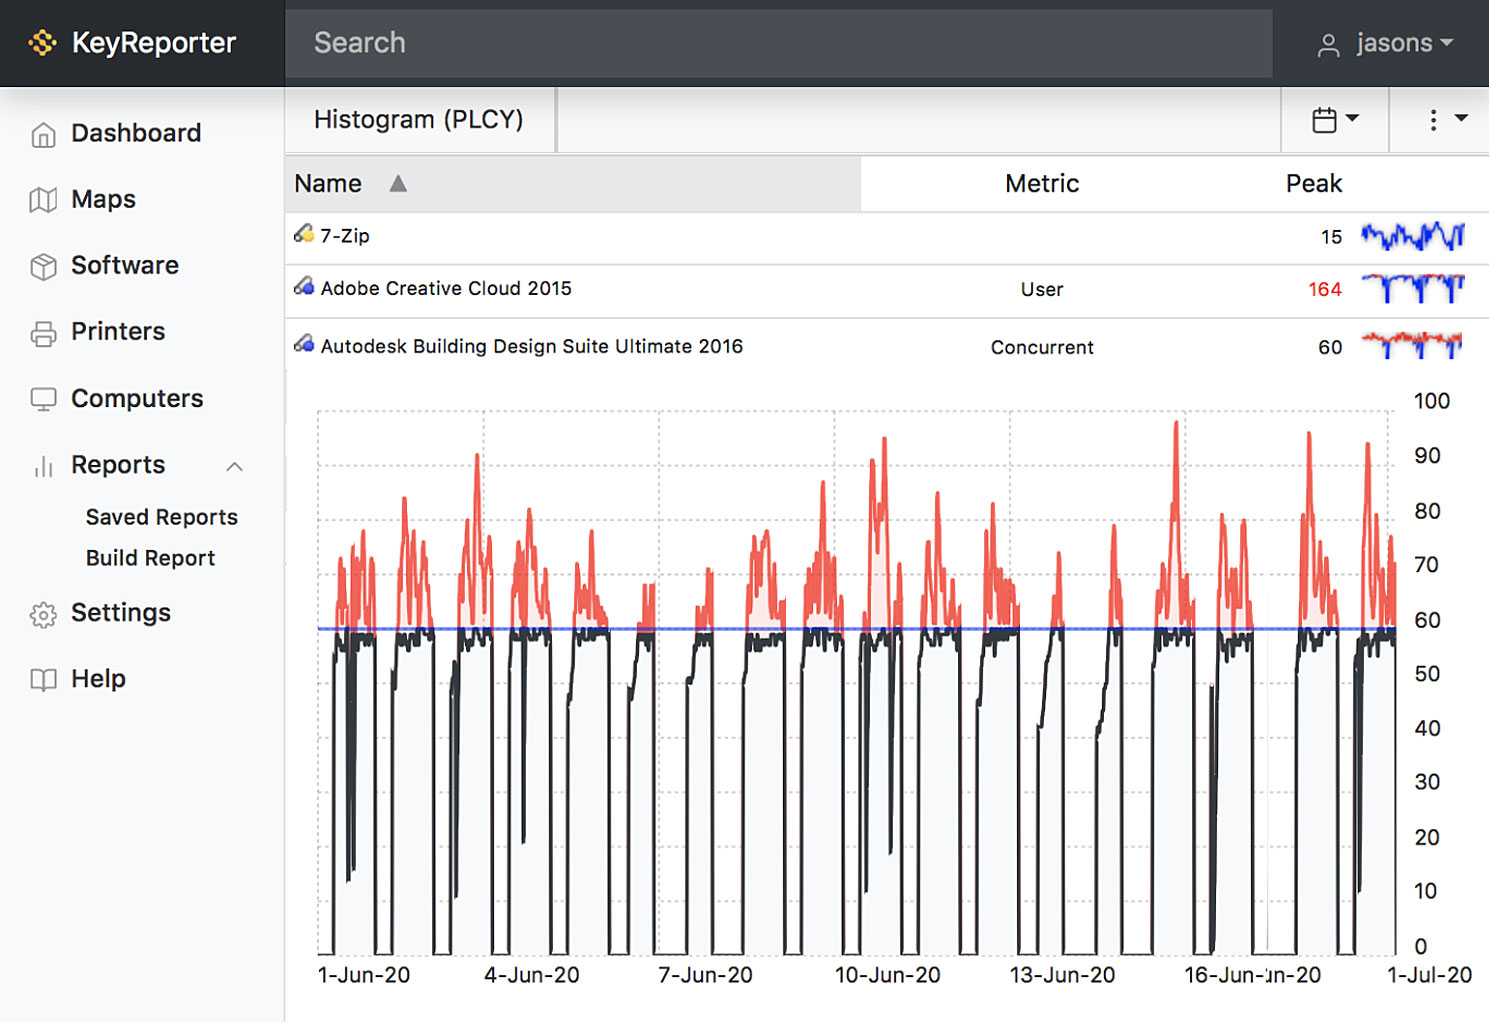
Computer login and software launch counts, total time, peak concurrent usage, weekly averages can all be broken down by room, computer, user, and more. Run usage reports across any date range or time period, across the entire data set or targeting specific products, programs, computers, or users.


Data Visualization
Each administrator and/or limited access user is assigned their own customizable dashboard, with charts, graphs, and tables presenting exactly the information they need. Automatically scope the page to specific computer groups, or view data for the network as a whole.
Distributed Access
Reports can be scheduled to run automatically and emailed to specific users, or run on demand from pre-configured One-click report templates. Limited access accounts give non-admin users direct access to the data and reports they need, while hiding sensitive data. Reports can be generated using our desktop installed admin console, or from any internet browser with our accessible web interface.


Easy Exports
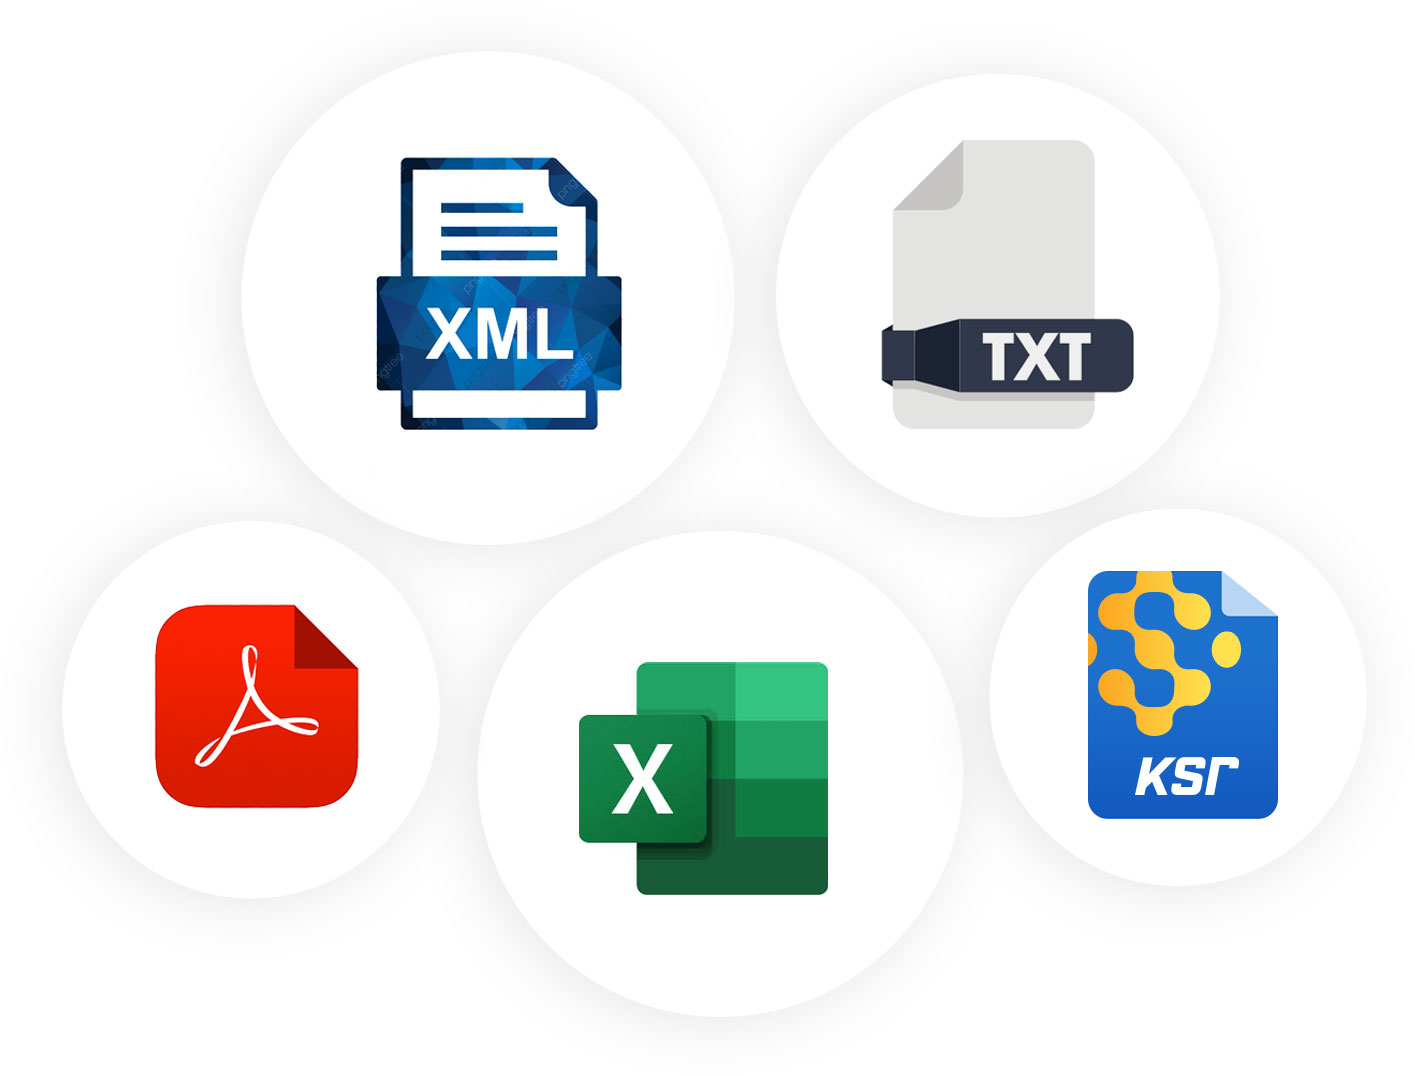
Save reports in Excel formats (xlsx and xml) to quickly create your own pivot tables and graphs, save to PDF to share directly with others, or export to a text file to import data into another database. Our native ksr format lets you dynamically “flip” the report view, customize columns after the report has run, and dig deeper into the data by selecting objects from one report as the target for another.
Three Great Products to Select From
KeySight
LabSight
AllSight
Request a Demo
Contact us to see how these features will help you gain insight and reduce your IT Asset Management costs.